
If you have spent any time scrolling through housing market news lately, you have probably noticed a recurring theme. The talking heads love to throw around big, sweeping generalizations about “the market.” They will tell you that the market is crashing because listings are up, or they will claim it is impossible to buy because options are scarce.
But anyone who actually lives and works in Los Angeles knows a fundamental truth: there is no single “L.A. housing market.”
Real estate is hyper-local. What is happening down the road in Westchester has almost zero bearing on what is happening behind the gates in Bel Air or along the hillsides of Silver Lake. When we talk about how market dynamics impact your wallet, your timeline, and your peace of mind, it all comes down to one critical metric: housing inventory.
Understanding inventory—what it is, how it behaves in your specific neighborhood, and how to read the signals it sends—is the ultimate secret weapon for both buyers and sellers. Let’s pull back the curtain on what housing inventory really means for you right now in Los Angeles.
Original Source Data Note: This deep-dive analysis is built upon the comprehensive regional market insights and strategic framework published throughout our blog.
FAST FACTS
- Inventory Defined: Inventory is the total number of homes actively available for buyers to purchase at any given time.
- The “Relevant” Inventory Filter: Gross market inventory numbers are misleading; buyers must filter by price point, specific neighborhood micro-markets, and property type to see true availability.
- Low Inventory Dynamics: When scarce, good homes demand rapid decision-making, shorter contingency windows, and highly competitive, aggressive offers.
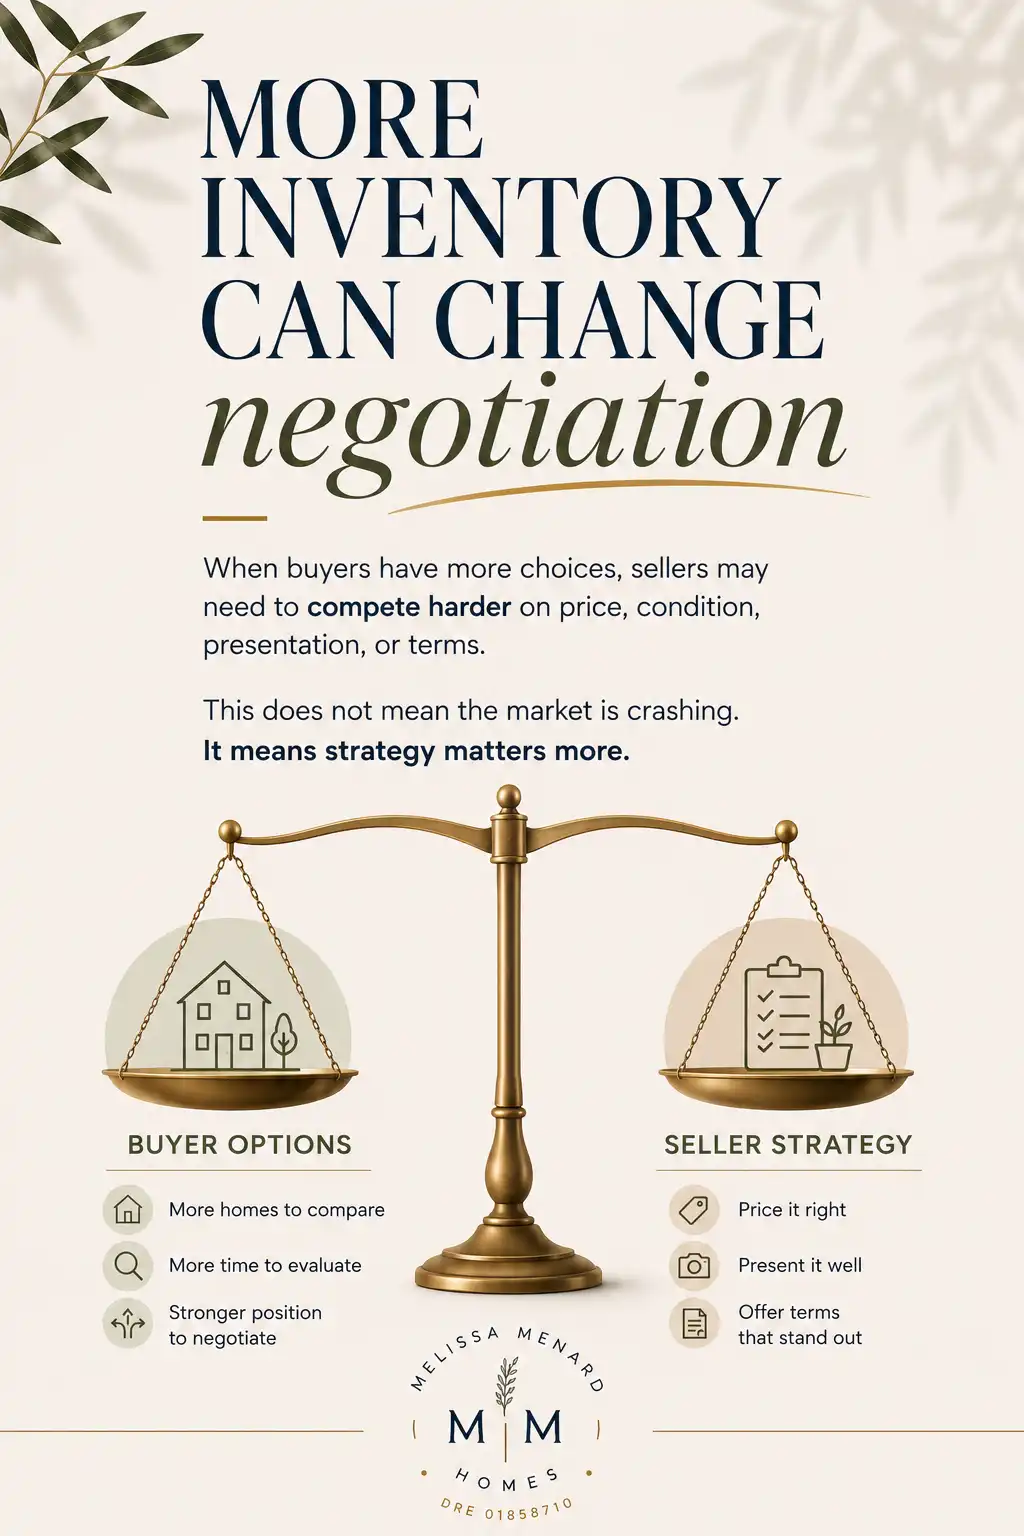
- Rising Inventory Dynamics: More choices do not equal a market crash; instead, it shifts leverage, allowing buyers more evaluation time while requiring sellers to execute superior pricing and presentation strategies.
- Hyper-Local Divergence: L.A. neighborhoods operate on completely different inventory planes simultaneously (e.g., Bel Air’s luxury estate scarcity vs. Silver Lake’s unique urban micro-market leverage).
What Does “Inventory” Actually Mean? (Hint: It’s Not Just Total Listings)

In the simplest terms, inventory equals available choices. It represents the supply side of the classic supply-and-demand economic equation. If demand is high and inventory is low, prices generally go up. If supply outpaces demand, prices cool down.
However, looking at the total number of active listings across the entire Westside or the Greater Los Angeles area will give you an incomplete, and often inaccurate, picture. The real question you need to ask is: How much relevant inventory is available in your price point, your target neighborhood, and your specific property type?
[ ALL ACTIVE LISTINGS ] ──> [ RELEVANT PRICE & LOCATION ] ──> [ TRUE GOOD MATCHES ]
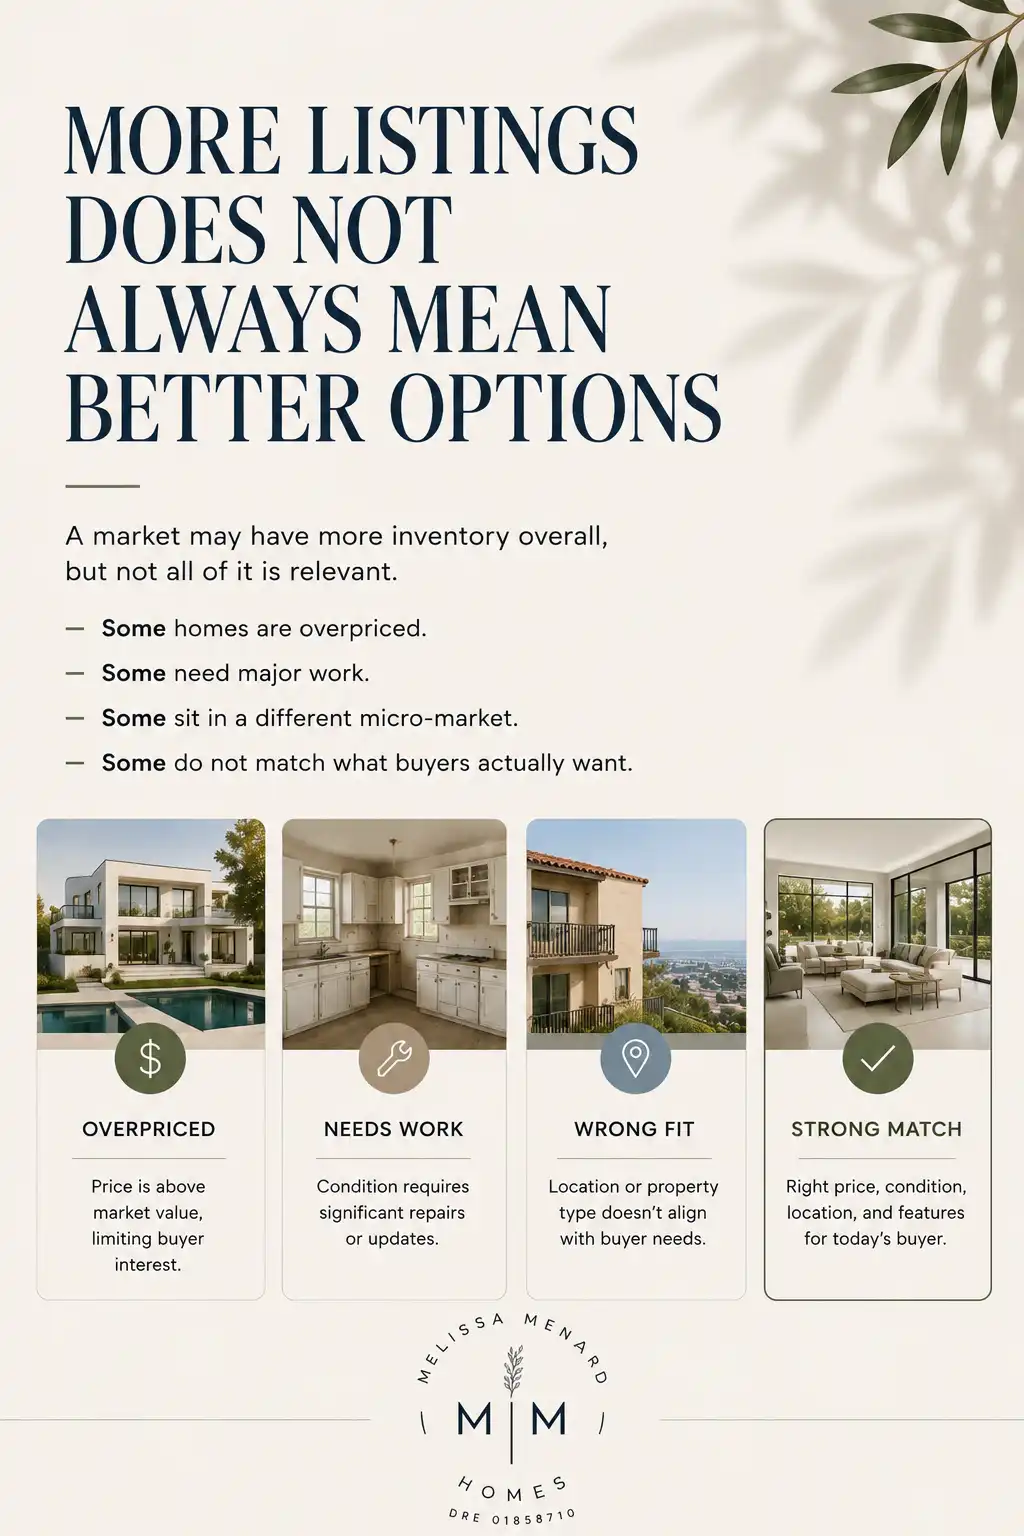
Think of it as a funnel. A headline might scream that L.A. inventory has spiked by 20%. But if you look closer, you might find that 90% of those new listings are ultra-luxury estates over $10 million, or fixer-upper condos requiring cash-only buyers. If you are searching for a turnkey, single-family home in Brentwood between $2.5 million and $3.5 million, your actual, relevant inventory might not have changed at all.
To make smart decisions, you have to look past the raw numbers and separate the noise from the homes that actually match your real-world criteria.
For Buyers: How Inventory Shapes Your Choices and Leverage
When you are hunting for a home in Los Angeles, the prevailing inventory conditions dictate your entire daily routine, your emotional stress levels, and your negotiating posture.
1. The Reality of Low Inventory: Speed and Scarcity
When relevant inventory is low, good homes are scarce. In this environment, serious buyers have to move fast. There is simply no room for hesitation.
- Shorter Decision Windows: You can’t “sleep on it” for a weekend. If a beautifully staged home hits the market in a tight neighborhood, you need to see it immediately and be prepared to write an offer.
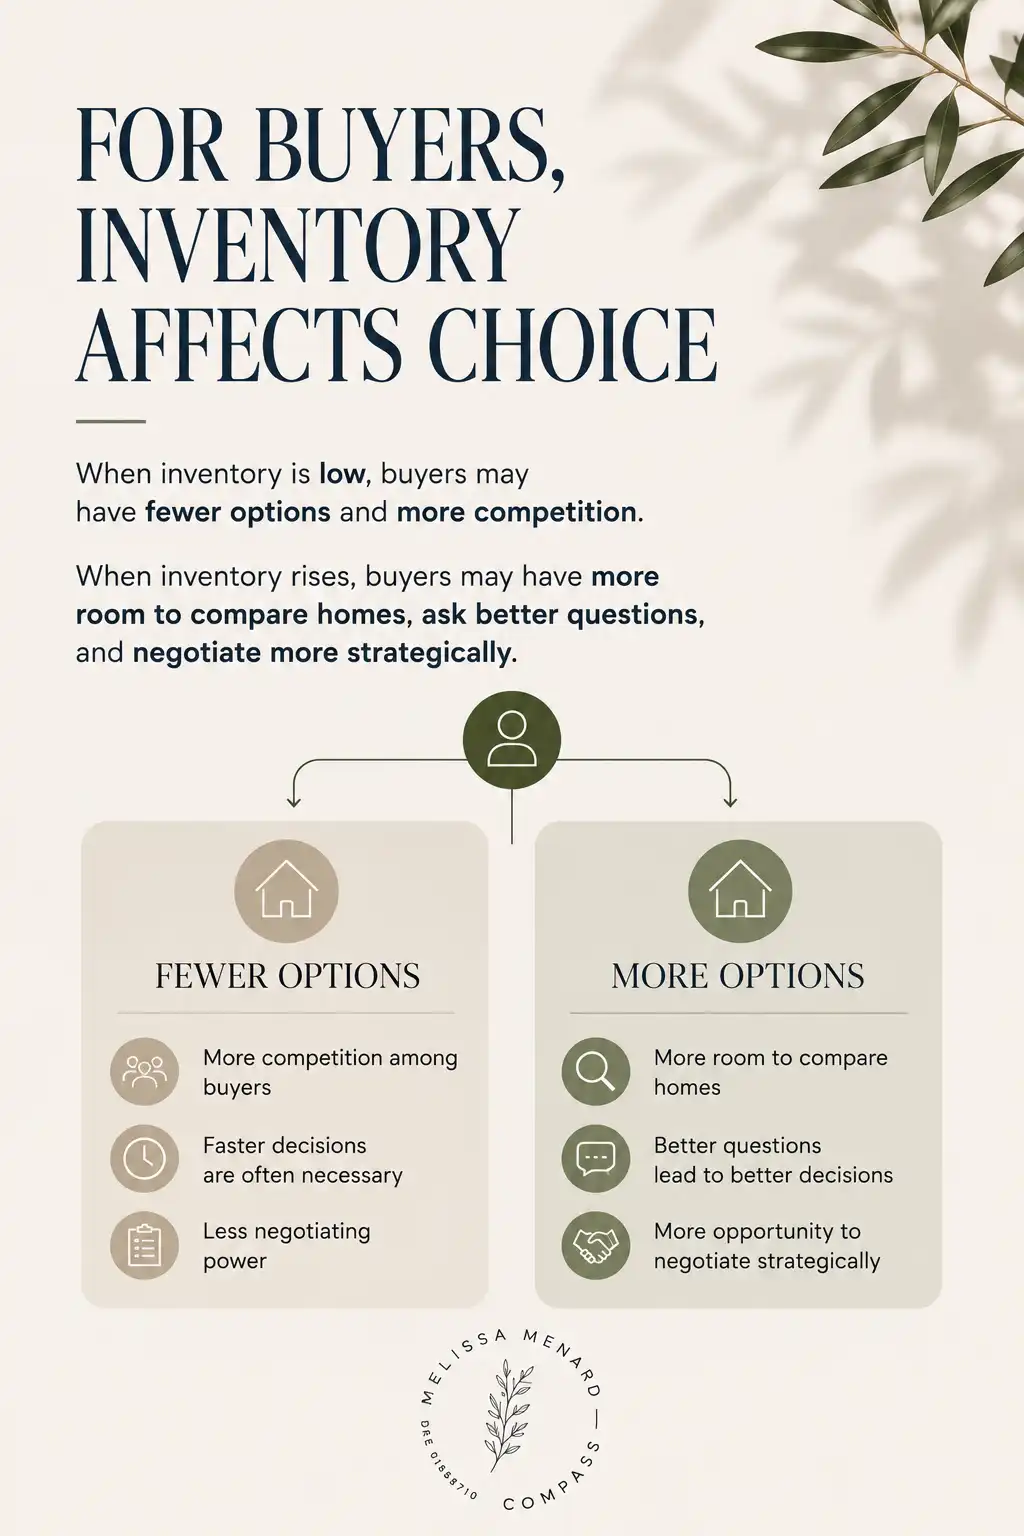
- Fewer Options, More Competition: You are competing with dozens of other qualified buyers who look exactly like you on paper. This frequently leads to multiple-offer situations, bidding wars, and offers written over the asking price.
- Diminished Negotiating Power: Sellers hold the cards. In low-inventory environments, buyers often have to concede on terms, accept shorter inspection periods, or waive certain contingencies just to stand out.
2. The Reality of Rising Inventory: Room to Breathe
When inventory rises, the entire atmosphere changes. It doesn’t mean the market is cratering; it just means buyers get their leverage back.
- More Room to Compare: Instead of forcing yourself to love the one house available this month, you can actually compare three or four viable properties side-by-side.
- Better Questions Lead to Better Decisions: When you aren’t terrified of losing out to ten other buyers, you have the time to ask deep questions about the property’s condition, HOA health, or neighborhood development plans.
- Strategic Negotiation: You can ask for price adjustments, seller concessions, or repair credits without worrying that the seller will instantly kick you to the curb for a backup offer.
For Sellers: Your Home is Not Listed in a Vacuum

Many homeowners assume that because their home is beautiful, it will automatically command top dollar and sell in a weekend. But the reality is that your home is always competing against other available choices. Buyers are rational shoppers. They are comparing your property against every other home available in your price tier and zip code at that exact moment. More competing inventory directly impacts your showing activity, your days on market, and ultimately, your final sales price.
Let’s look at how competing inventory plays out in the real world:
| Market Metric | Your Home (Turnkey & Positioned Right) | Competing Home A (Slightly Overpriced) | Competing Home B (Deferred Maintenance) |
| List Price | $2,450,000 | $2,395,000 | $2,495,000 |
| Showing Activity | Strong (Packed open houses) | Moderate (Steady but slow) | High (Initial curiosity only) |
| Days on Market | 12 Days | 28 Days | 35 Days |
| Market Positioning | Stands Out (Turnkey presentation) | Similar (Lacks premium feel) | Similar (Overpriced for work needed) |
Even if Competing Home B has a slightly larger footprint, if it is overpriced and needs work, your turnkey home listed at $2,450,000 will shine by comparison. Conversely, if three other immaculate, identical homes list in your neighborhood next week for $2,400,000, your home suddenly faces stiff competition, and your strategy must adapt.
More inventory doesn’t mean you can’t sell for a premium; it simply means your strategy, presentation, and pricing must be completely flawless.
Inventory is Hyper-Local: A Tale of Four L.A. Markets
To truly understand how supply and demand play out across Los Angeles, you have to look at our distinct neighborhoods. The market dynamics can shift dramatically across just a few miles.
Bel Air: Luxury Estates
- The Dynamic: Low inventory, high demand.
- The Reality: The ultra-high-net-worth space operates on its own rules. Exceptional parcels, architectural pedigree, and massive, private estate lots are inherently limited. When an iconic estate hits the market, global demand keeps the environment highly competitive, regardless of broader economic headwinds.

Brentwood: Balanced Family Neighborhoods
- The Dynamic: Steady demand, balanced inventory.
- The Reality: Brentwood remains a perennial favorite for buyers seeking classic neighborhoods, excellent schools, and proximity to the Westside. Inventory here tends to move at a steadier, more predictable pace. Buyers have options, but premium properties that are priced correctly still sell rapidly.
Silver Lake: Creative, Urban Micro-Market
- The Dynamic: High buyer leverage, unique property dynamics.
- The Reality: Known for its hillside architectural mid-centurys, character duplexes, and vibrant street life, Silver Lake can experience sudden shifts in inventory. Because the inventory is highly idiosyncratic (steep lots, varied parking situations, historic overlays), buyers often have more leverage to evaluate unique properties thoroughly before making a move.
Westchester: Coastal Access and Pace
- The Dynamic: Coastal demand drivers, shifting pace.
- The Reality: With close proximity to Silicon Beach, LAX, and the ocean, Westchester is heavily influenced by corporate relocations, tech sector shifts, and aerospace employment. The inventory pace here can change rapidly based on corporate housing demands, creating distinct windows of opportunity for sharp buyers and sellers.
Watch the Inventory Signals: Good Data Leads to Better Decisions
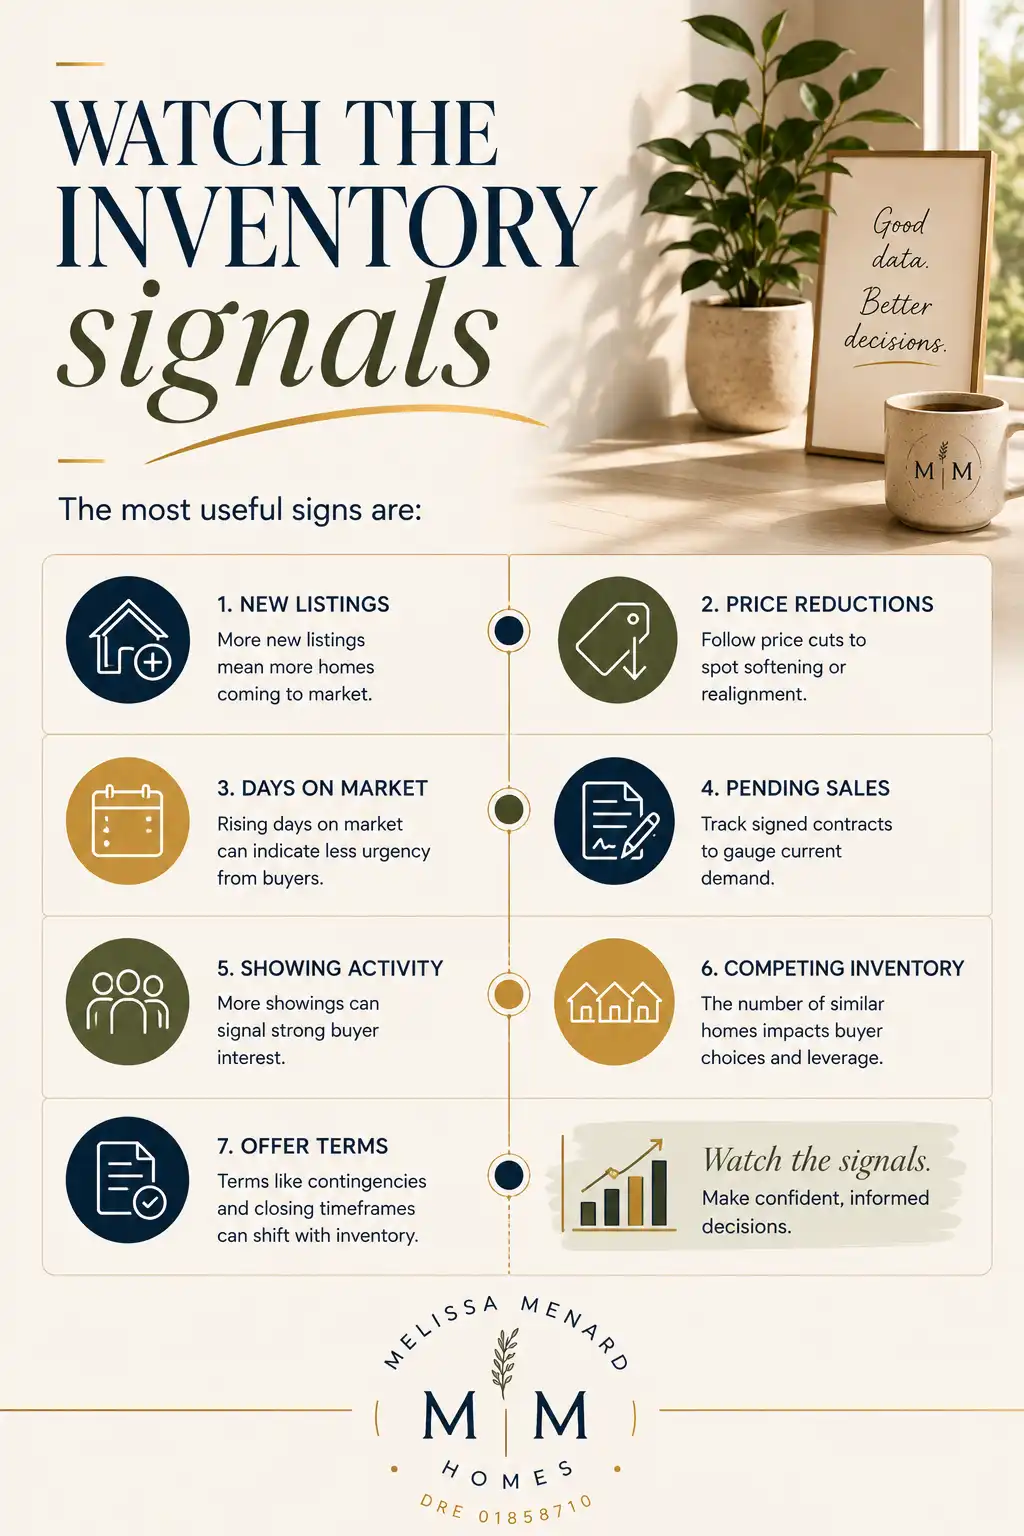
If you want to anticipate where your local micro-market is heading, you don’t need a crystal ball. You just need to keep a close eye on these seven core inventory signals:
- New Listings: A sudden influx of new listings means more supply is hitting the market, giving buyers more options and creating more competition for existing sellers.
- Price Reductions: Tracking the number of price cuts in a specific zip code is the fastest way to spot market softening or a needed realignment in expectations.
- Days on Market (DOM): When the average days on market starts rising, it indicates a lack of urgency from buyers, signaling that inventory is beginning to pile up.
- Pending Sales: This tracks signed contracts. Comparing pending sales to new listings tells you exactly whether demand is keeping pace with supply.
- Showing Activity: A high volume of showings signals strong underlying buyer interest, which typically precedes a drop in available inventory.
- Competing Inventory: Monitoring the exact number of similar homes available directly helps you understand your relative leverage at any given moment.
- Offer Terms: When inventory is high, terms loosen up (more contingencies, longer timelines). When inventory is low, terms tighten dramatically.
The Bottom Line: Strategy Outlasts Market Fluctuations
At the end of the day, an inventory shift is not something to fear. It is simply a set of data points to be understood and leveraged. Whether you are aiming to purchase your dream home along the coast or looking to maximize the equity in your long-time family estate, the right move never depends on generic national headlines.
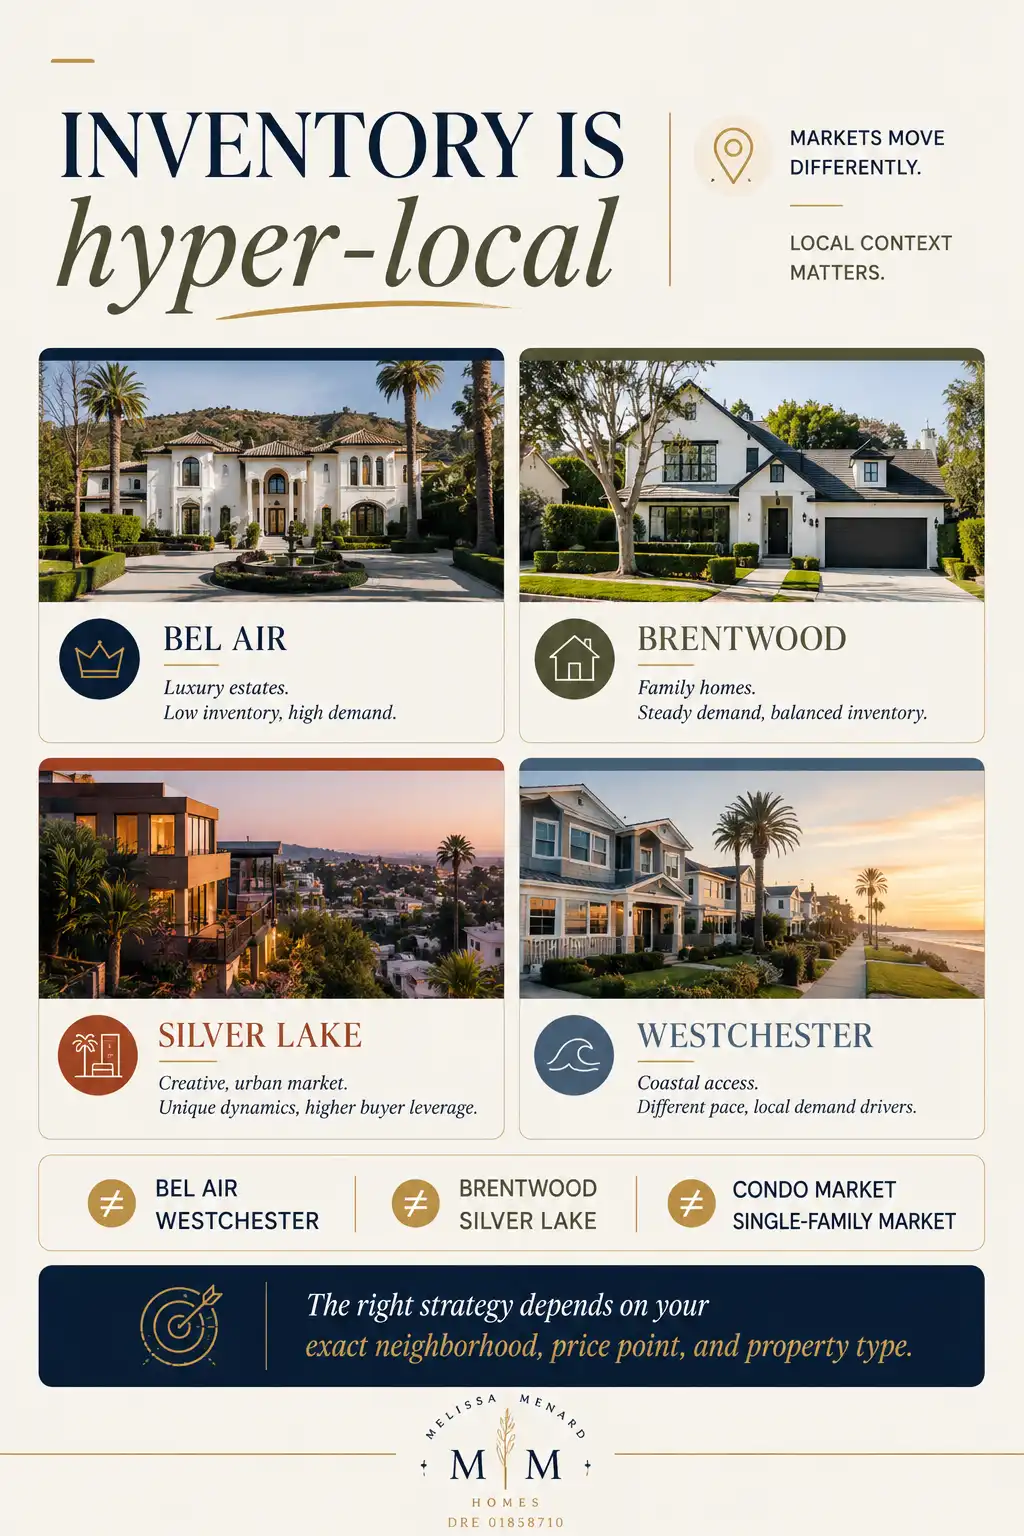
It depends entirely on your exact neighborhood, your price point, your property type, and the professional strategy you put behind it.
Frequently Asked Questions (FAQ’s)
1. What exactly counts as “housing inventory” in real estate?
Housing inventory refers to the total number of homes that are actively listed for sale on the market within a given geographic area at any specific time. It includes single-family homes, townhomes, and condos that are classified as “Active” in the Multiple Listing Service (MLS), excluding properties that are already under contract or pending sale.
2. Why do real estate agents emphasize that inventory is “hyper-local”?
Real estate is hyper-local because macroeconomic factors (like national interest rates) express themselves differently based on local micro-dynamics. For example, a tech hiring boom might cause inventory to plummet and prices to soar in a neighborhood close to Silicon Beach, while an entirely different neighborhood fifteen miles away remains balanced or slow.
3. How does low housing inventory affect home prices in Los Angeles?
When housing inventory is low and buyer demand remains steady or high, home prices are naturally driven upward. Because multiple buyers are competing for the same limited pool of homes, it frequently triggers bidding wars, forcing final sales prices above the original list price.
4. Does a sudden increase in new listings mean the L.A. market is crashing?
No. An increase in listings simply represents a rebalancing of the market. Often, a rise in inventory is a healthy correction that gives buyers breathing room and prevents unsustainable, runaway price inflation. It signals a shift toward a more balanced, sustainable market, not a crash.
5. What is the difference between “gross inventory” and “relevant inventory”?
Gross inventory is the total number of homes for sale across an entire city or region. Relevant inventory is the highly filtered subset of homes that actually fit your specific budget, preferred neighborhoods, structural layout, and property condition. Relevant inventory is the only metric that truly matters to your transaction.
6. How can a buyer find out what the inventory is like in a specific L.A. neighborhood?
The most reliable way is to request a neighborhood-specific snapshot from a local real estate professional. This data is pulled directly from the local MLS and analyzes hyper-focused metrics like active listings, pending contracts, and localized absorption rates that public search portals often gloss over.
7. What is “Months of Inventory” or “Absorption Rate”?
Months of inventory (or absorption rate) measures how long it would take for all current homes on the market to sell if no new listings were added, assuming a constant pace of sales. Generally, less than 4 months of inventory indicates a Seller’s Market, 4 to 6 months represents a Balanced Market, and over 6 months indicates a Buyer’s Market.
8. Why do some homes sit on the market even when overall inventory is incredibly low?
Even in a severe inventory shortage, individual homes will languish on the market if they suffer from poor market positioning. Common culprits include unrealistic overpricing, significant deferred maintenance or structural issues, poor layout, or an undesirable location (such as backing up to a major freeway).
9. As a seller, how should I adjust my strategy if local inventory is rising?
If competing inventory is on the rise, your strategy must pivot to ensure your home remains the most attractive option available. This means you must price it aggressively right out of the gate, invest heavily in high-end staging, professional photography, and premium presentation, and be flexible on buyer terms.
10. How does showing activity relate to housing inventory trends?
Showing activity is a leading indicator of market direction. A sudden spike in showing activity across a neighborhood means buyer demand is warming up. If that showing activity results in offers, the available housing inventory will begin to drop shortly thereafter.
11. What are “Days on Market” (DOM), and why should I track them?
Days on Market tracks how many calendar days an active listing has been sitting on the MLS. A low average DOM across a neighborhood means buyers are snatching up homes instantly due to low supply. A rising DOM indicates that buyer urgency is fading and inventory levels are expanding.
12. Can a neighborhood experience low inventory for single-family homes but high inventory for condos?
Absolutely. This is a common phenomenon in dense urban areas. A neighborhood may have an absolute scarcity of detached single-family homes with yards, creating a fierce seller’s market for houses, while simultaneously experiencing a surge in high-rise condo completions that creates a buyer’s market for attached units.
13. How do mortgage interest rates impact housing inventory levels?
Interest rates affect both sides of the inventory equation. High interest rates can cause a “lock-in effect,” where current homeowners refuse to sell because they do not want to give up their historically low rates, keeping inventory suppressed. Conversely, higher rates also reduce buyer purchasing power, which can cause existing inventory to sit longer.
14. What does it mean when a market has a high volume of price reductions?
A high volume of price reductions means that sellers in that specific area originally misjudged buyer demand or priced their properties ahead of the market. It is a clear signal that supply has caught up to or outpaced demand at those specific price points, forcing sellers to realign their expectations to attract a buyer.
15. How do offer terms and contingencies change based on inventory shifts?
In low-inventory markets, buyers have to present “clean” offers with short contingency periods, rapid closing timelines, and minimal seller repair demands. In high-inventory markets, buyers can successfully negotiate for extended inspection periods, home sale contingencies, closing cost credits, and substantial repairs.
Ready to Navigate the L.A. Market with Confidence?
Whether you are looking to buy or sell, navigating the shifting currents of Los Angeles inventory requires an experienced, analytical hand. Let’s make sure your next real estate move is backed by real data, clear strategy, and exceptional execution.
Request a hyper-local Custom Equity Audit or a Neighborhood Inventory Snapshot tailored to your exact street and price tier.

Melissa Menard REALTOR® | Compass
Local expertise. Proven results.
Los Angeles & Surrounding Areas
📞 310.729.9726 | DRE# 01858710
📧 melissa@melissamenardhomes.com
🌐 www.MelissaMenardHomes.com
Disclaimer: The information provided in this post is for educational purposes only and does not constitute financial, legal, or investment advice. Market conditions are subject to change. Please consult with a qualified professional regarding your specific real estate needs and local Fair Housing regulations.