


Welcome to your essential June 2026 real estate market update, specifically tailored for buyers, sellers, and individuals planning a relocation within a 0–12 month horizon in Los Angeles and its surrounding premier neighborhoods. As we move deeper into the summer season, both the national landscape and our hyper-local Southern California markets are experiencing a unique set of economic crosscurrents. Shifting mortgage rates, a resilient stock market, and flatlined inventory levels are defining the choices available to consumers today.
To review the raw data points and charts driving this month’s comprehensive analysis, you can access the original June 2026 National Recap file repository here: Source Data Link.
FAST FACTS
- Mortgage Rates Bounce Off Lows:
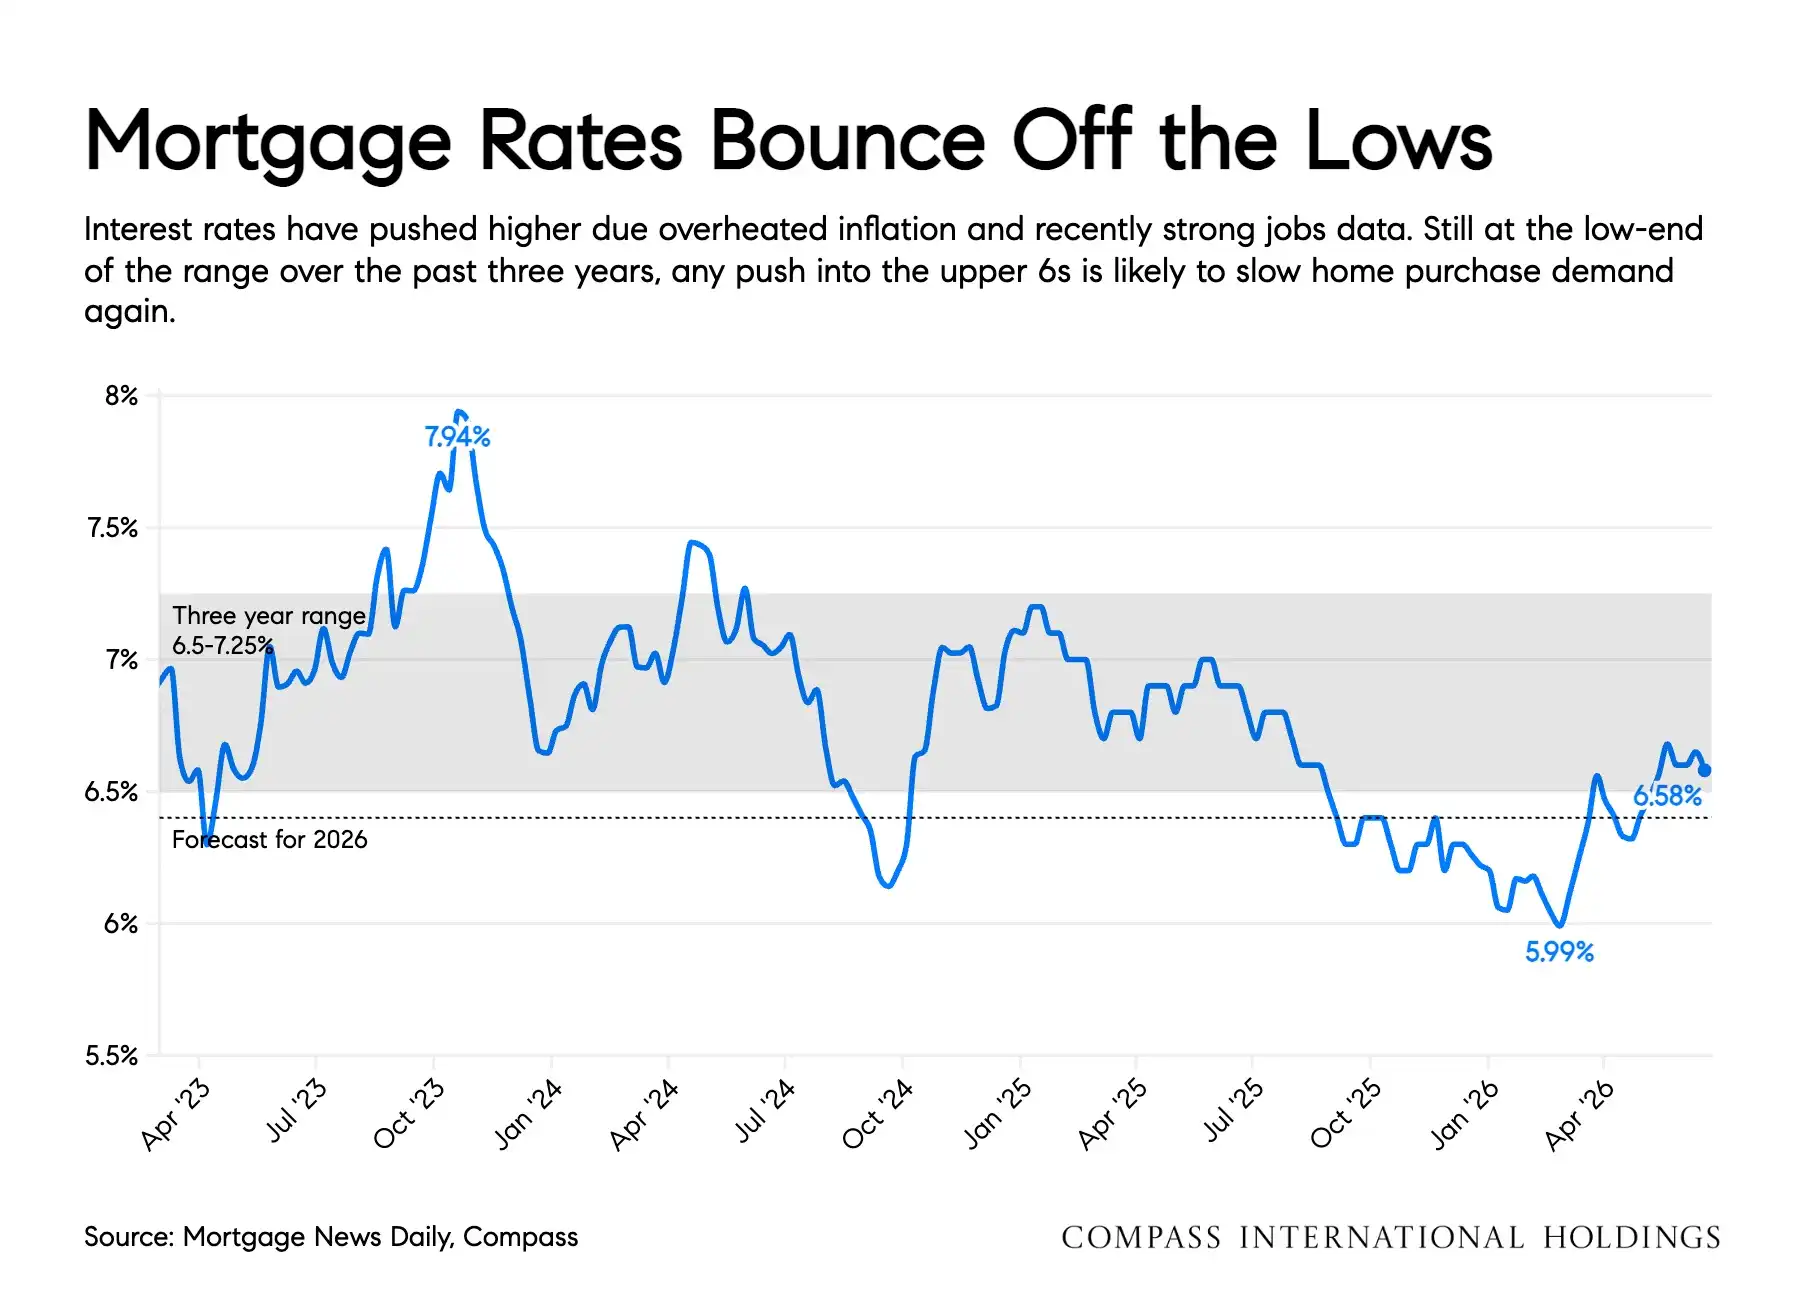
Current mortgage rates have edged upward to approximately 6.58%, remaining within the three-year historical baseline of 6.5% to 7.25%. - Pending Sales Show Strong Momentum:
High-frequency data tracks nine consecutive weeks where weekly pending home sales outpaced 2025 volumes, showing a 4.2% year-to-date increase. - Inventory Growth Has Stalled Completely:
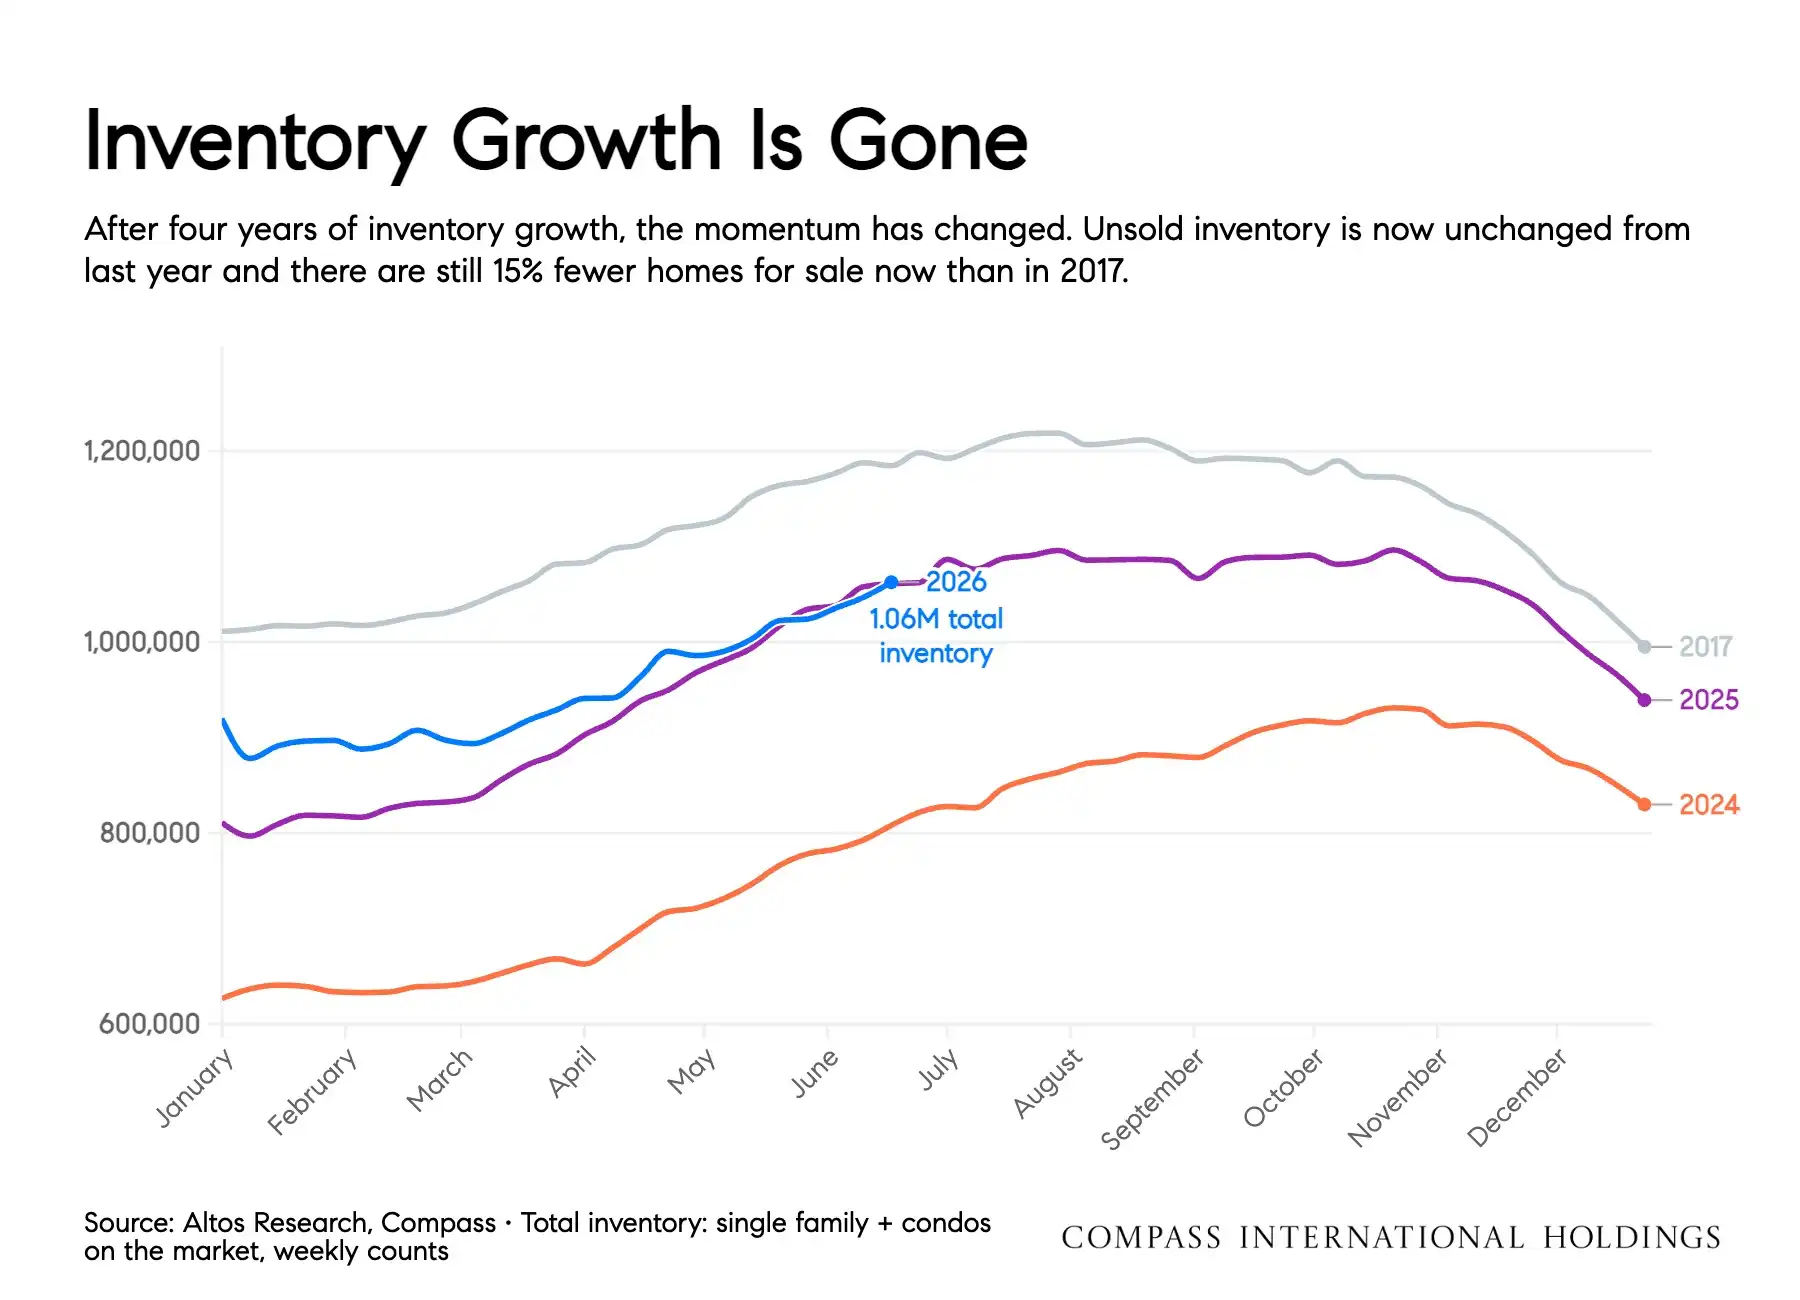
Unsold housing inventory has flattened year-over-year at 1.06 million units nationwide—a striking 15% fewer homes for sale than in 2017. - The “Wealth Effect” Propels Demand:
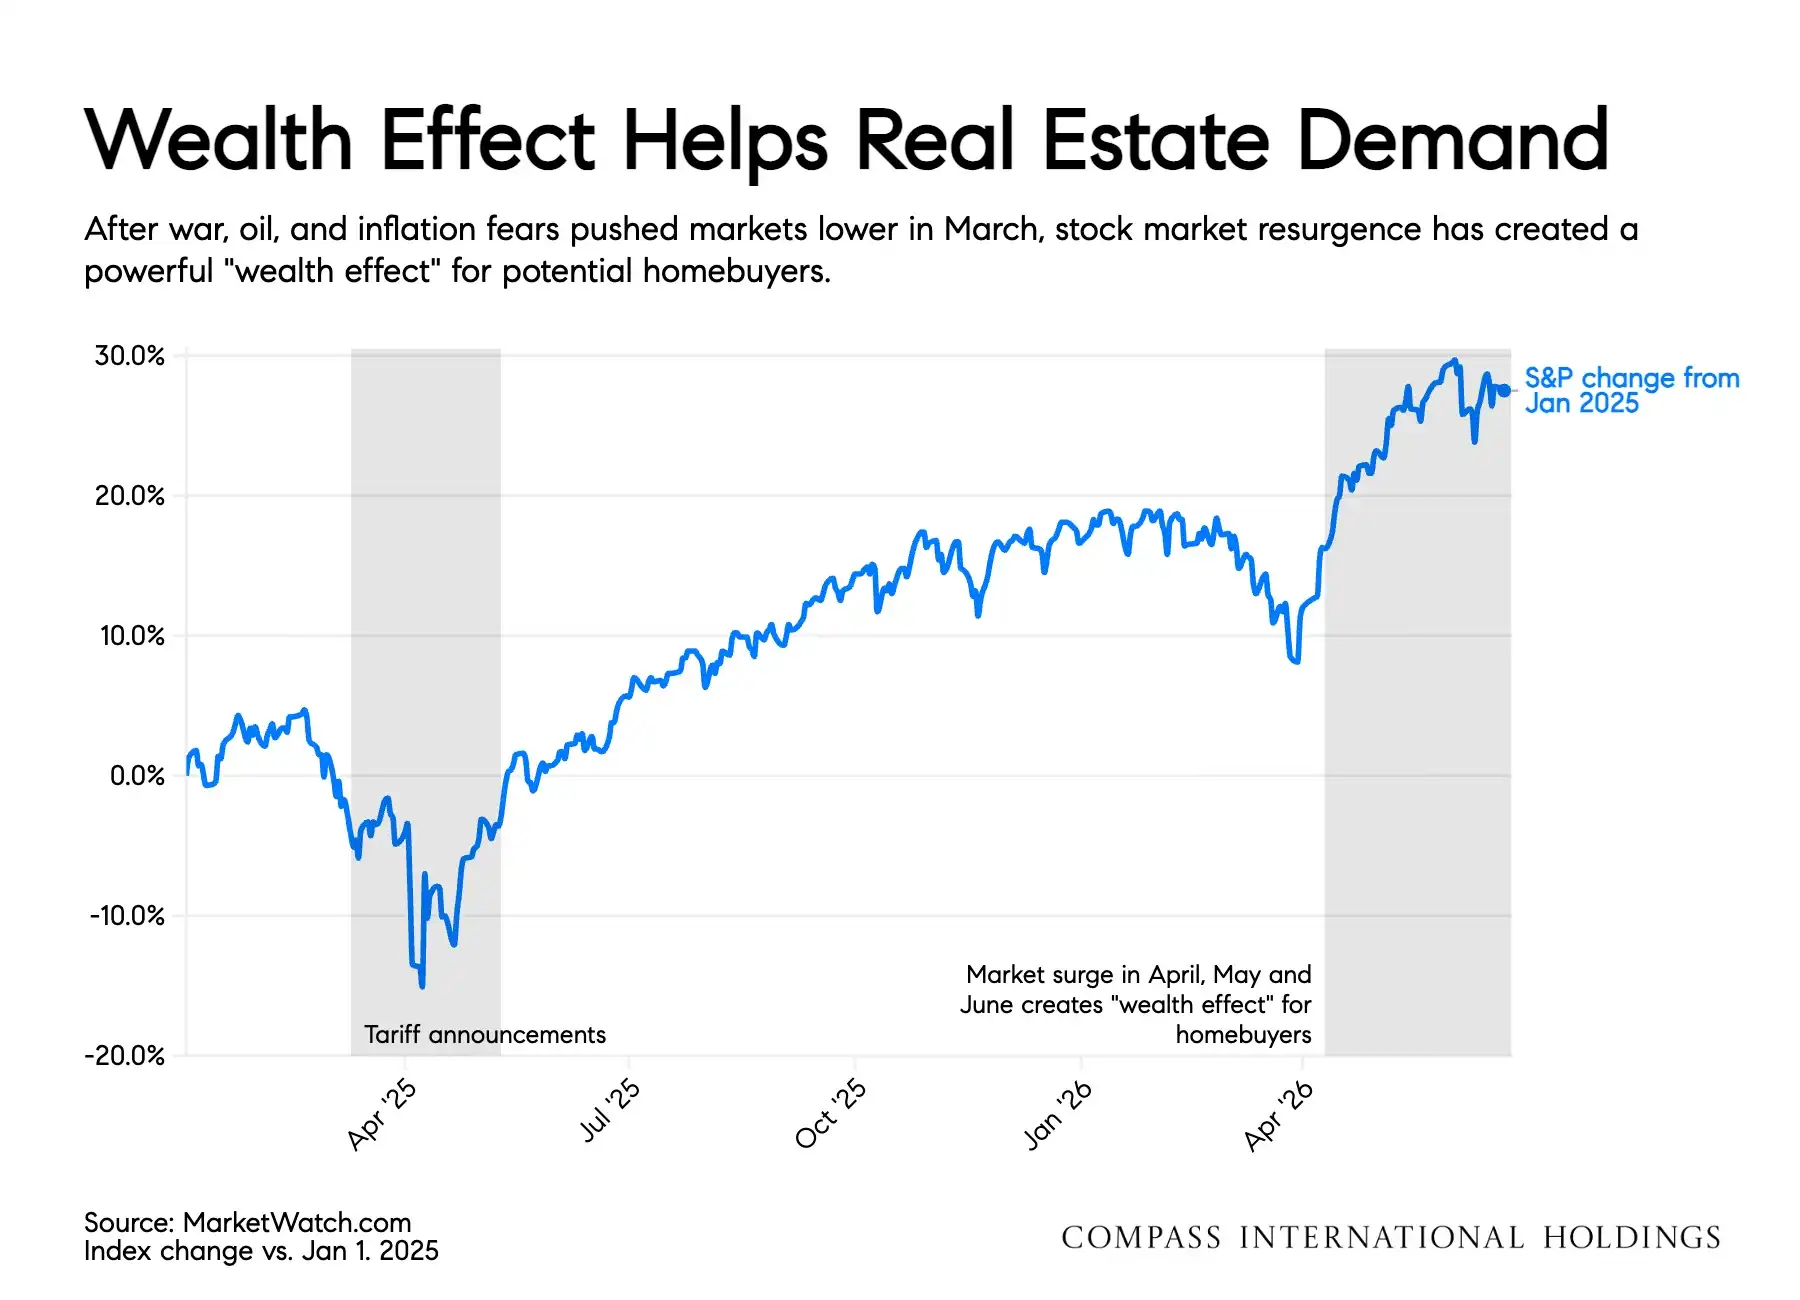
Significant stock market performance during April, May, and June has infused affluent buyers with liquid capital and renewed purchasing confidence. - L.A. Prices Remain Exceptionally Resilient:
Even as national active list prices see minor downward compression, core metro areas like Los Angeles maintain stable, positive year-over-year sales price appreciation. - Mortgage Delinquency Remains Remarkably Low:
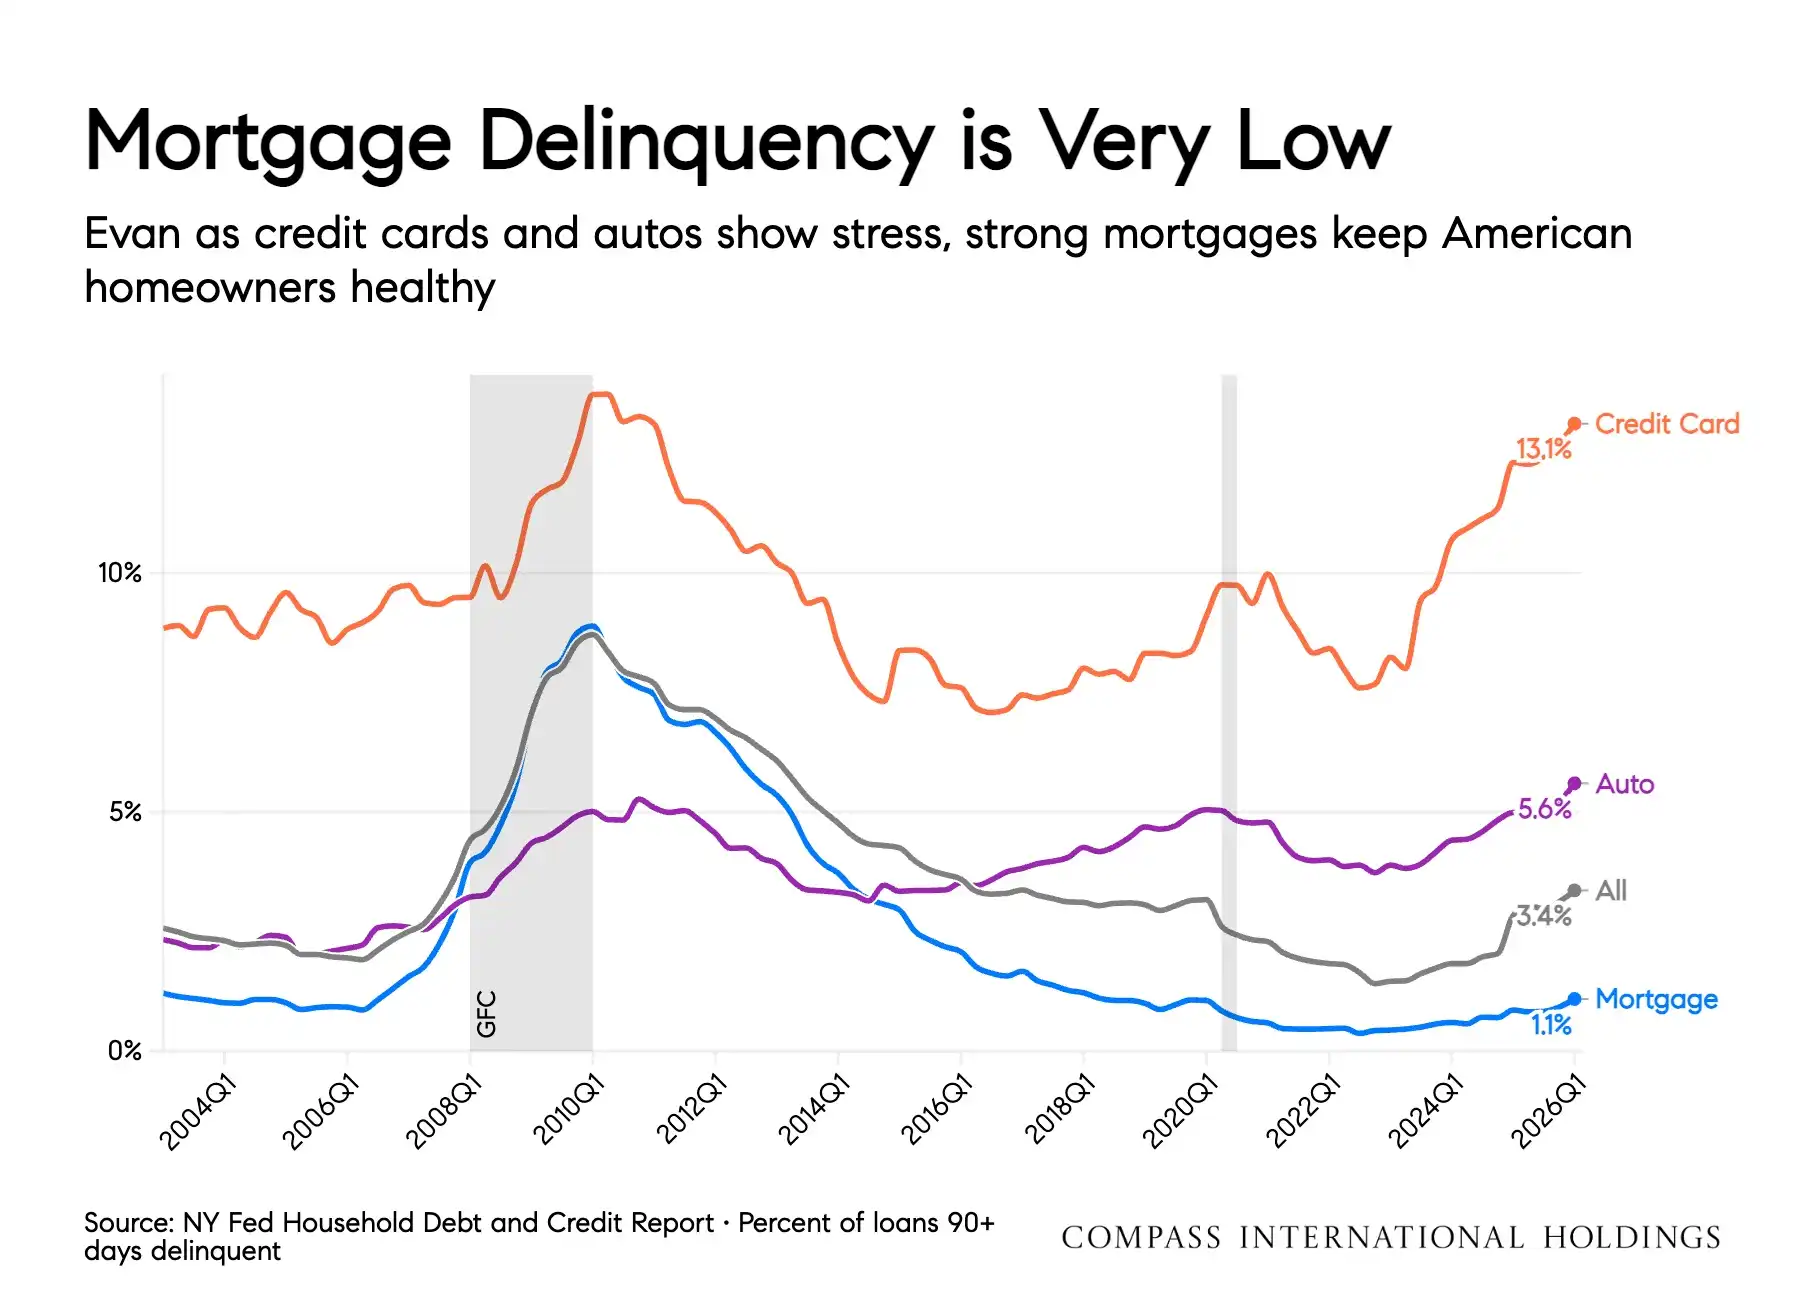
At just 1.1% of loans 90+ days delinquent, American homeowners remain financially robust, preventing any wave of distressed properties. - New Construction Velocity Declines:
Permits, starts, and units under construction are in multi-year declines, further strangling future housing supply.
The “Wealth Effect” vs. Sticky Inflation in Southern California
The current economic landscape in Southern California presents a compelling paradox. On one side of the ledger, consumer price metrics remain stubborn. Tariffs, energy costs, and continued fiscal expenditure have caused a re-acceleration of inflationary data since early spring. The Consumer Price Index (CPI) currently measures 4.2% while Personal Consumption Expenditures (PCE) rest at 3.8%—both fundamentally detached from the Federal Reserve’s long-term 2% target rate. This persistent inflation has kept pressure on fixed-income instruments, forcing mortgage interest rates back up to a reading of 6.58%. For a segment of the market, this dynamic tightens monthly debt-to-income boundaries and impacts raw purchasing power.
However, in the premier neighborhoods of Los Angeles—from the Westside to the San Fernando Valley—this pressure is met by an equally potent counterforce: the “Wealth Effect.” Following a brief period of volatility in March driven by global trade announcements and energy market fears, the equities market experienced a massive upward surge throughout April, May, and June.
For high-net-worth individuals and professionals planning a move, this stock market expansion acts as an immediate capital injection. Down payments are frequently funded via equity liquidation or portfolio-backed financing lines. When equity portfolios expand significantly over a 90-day window, the psychological and financial friction of a 6.58% mortgage rate diminishes. Buyers feel wealthier because they are wealthier, converting paper profits into concrete Southern California real estate assets. This explains why high-end transaction volume continues to move forward despite macro-level affordability metrics that might otherwise slow consumer activity down.
The Anatomy of Flatlined Housing Inventory
If you are currently evaluating properties in the Los Angeles area, you have undoubtedly noticed that available properties disappear quickly and premium listings face stiff competition. The structural engine behind this environment is the absolute erasure of inventory growth. Over the previous four years, the real estate market experienced a gradual recovery in the volume of unsold homes. In June 2026, that upward momentum stopped.
Total unsold inventory across single-family homes and condominiums stands at 1.06 million units nationwide, tracking completely flat compared to this time last year. To understand how restricted this market truly is, current inventory sits a full 15% below the baseline established in 2017—a period that was considered balanced, if not slightly tight.
Why has listing inventory dried up? The answer lies in the ongoing mathematical reality of the “lock-in effect.” It is estimated that mortgage rate structures will prevent approximately 870,000 home sales nationally over the course of 2026. Homeowners who secured or refinanced their mortgages into sub-4% or even sub-3% fixed rates between 2020 and 2022 face a massive financial penalty if they choose to sell and purchase a subsequent property at 6.58%.
Unless driven by an indispensable life event—such as a corporate relocation, family expansion, or estate transition—these owners are choosing to retain their low-cost debt. While this lock-in effect naturally decays by a small percentage each year as families simply outgrow their spaces, its macro impact continues to suppress the traditional flow of inventory onto the market.
Compounding this issue is the stark reality of the new construction pipeline. Builders are pulling back significantly. Permits, housing starts, and total residential units currently under construction are locked in multi-year declines. Single-family home units under construction and recent completions have hit their lowest collective levels since the pandemic era.
In a land-scarce metropolis like Los Angeles, where large-scale new tract construction is already geographically limited, this means buyers cannot look to new builds to alleviate the supply deficit. Competition is focused entirely on existing residential inventory, insulating home values from downward pressure.
Pending Sales Confirm Transaction Velocity
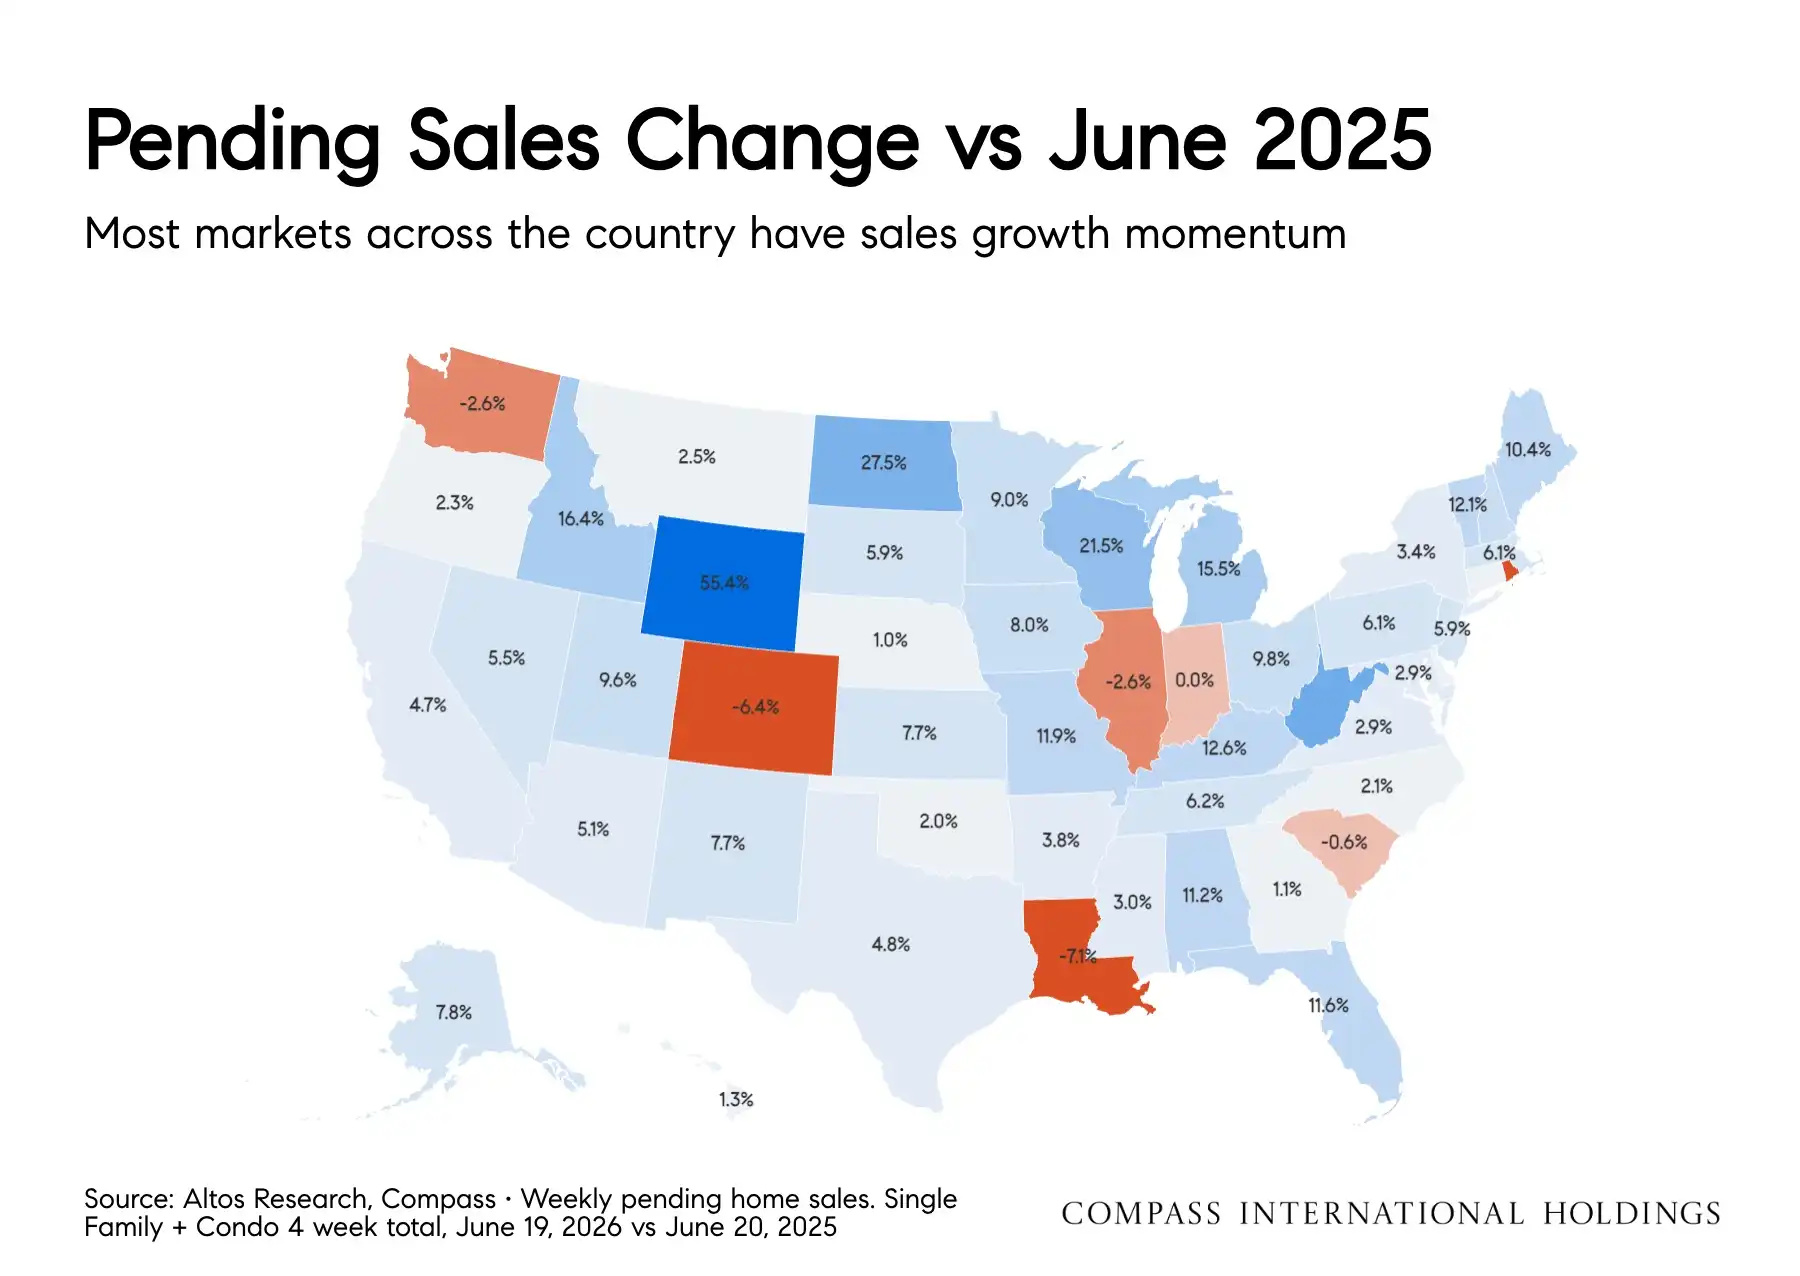
Despite restricted inventory and elevated interest rates, buyers are not sitting on the sidelines. The high-frequency leading indicators tell a clear story of transaction resilience. Through mid-June, pending home sales have recorded nine consecutive weeks of positive growth compared to the same weeks in 2025. Year-to-date, total pending transactions are up 4.2% nationally.
This is an essential indicator for anyone planning a transaction in the next 12 months: demand is outperforming the previous year because consumer sentiment has adjusted to the current interest rate environment. Last year’s market was marked by hesitation as buyers waited for rates to return to historical lows; this year’s buyers accept 6.5% as the baseline and are moving forward with their lives.
Leading transaction tracking mechanisms—such as Altos Pending counts, MBA Purchase Applications, and Xactus Mortgage Intent data—all confirm that forward-looking contract signings remain constructive. This transaction velocity varies by geographic region, creating a highly nuanced pricing landscape.
While backward-looking sales indices show that home prices nationally remain 0.7% above last year, individual metros show distinct paths. Cities with extreme inventory structural deficits, like Chicago, lead with strong appreciation metrics. Conversely, markets that experienced overbuilding over the last few years are seeing soft price adjustments.
Where does Los Angeles sit? L.A. remains in the positive appreciation category on the S&P CoreLogic Case-Shiller Index. The localized supply-and-demand imbalance ensures that while un-renovated or poorly positioned properties may see list price adjustments, correctly priced, turn-key properties continue to command premium market pricing.
Structural Credit Stability: Why a Crash is Not Materializing
A frequent question from buyers planning a move within the next year is whether current market conditions mirror the pre-crash dynamics of 2008. The household debt and credit data compiled by the New York Fed provides an unambiguous answer: the underlying credit foundation of the American homeowner is exceptionally strong.
While it is true that non-housing credit sectors are showing minor signs of consumer stress—with credit card delinquencies rising to 13.1% and auto loan delinquencies moving to 5.6%—the mortgage sector is performing perfectly.
Currently, only 1.1% of all outstanding residential mortgages are 90+ days delinquent. Homeowners are prioritizing their housing payments above all other obligations. This is driven by two main factors: stringent post-2010 lending standards that ensured borrowers were genuinely qualified, and an unprecedented accumulation of home equity.
Because homeowners possess significant equity stakes in their properties, any individual facing financial hardship has the ability to sell their home traditionally via the open market rather than facing a foreclosure proceeding. This eliminates the possibility of a wave of distressed bank-owned inventory hitting the market and destabilizing home values.
Additionally, national employment indicators remain supportive. While the broad hiring rate has softened slightly to 3.2%—which marginally limits long-distance job relocations—the labor market added a stable average of 114,000 new jobs per month through May 2026. Corporate profitability, artificial intelligence infrastructure capital expenditures, and steady public spending continue to underpin the broader expansion. A stable jobs landscape, paired with near-record low mortgage delinquencies, ensures the real estate market retains a solid structural foundation.
Strategic Guidance for Your Next 12 Months
For Active and Upcoming Buyers
Trying to time the exact bottom of the interest rate cycle is an ineffective long-term strategy. If inflation parameters ease later this year and mortgage rates drop toward the high 5% range, a massive wave of sidelined buyers will likely re-enter the market simultaneously. This influx of demand against our flatlined inventory will inevitably drive home prices upward through multiple-offer scenarios.
Your strategic advantage lies in acquiring the property that fits your lifestyle parameters during windows of rate stability like the one we are experiencing right now. You can utilize the equity generated by the recent stock market expansion to maximize your down payment, establish your position in a premier Los Angeles neighborhood, and maintain the option to refinance your underlying debt instrument if macro rates compress in the future.
For Potential Sellers
Your positioning remains highly favorable due to the severe lack of competing properties on the market. However, 2026 buyers are highly analytical and sensitive to overall property presentation. Homes that are improperly presented or priced according to outdated market peaks face immediate list price compression and extended days on market.
To maximize your net proceeds, your property must be positioned accurately using contemporary localized comparable data. Focus your capital preparation efforts on high-yield aesthetic updates and mechanical compliance. To understand the exact financial position of your property in the current market, executing a professional, customized audit of your home’s current equity structure is an essential first step before planting a sign in the yard.
Frequently Asked Questions (FAQ’s)
1. Are home prices dropping in Los Angeles right now?
No. While national statistics show minor list price compression on active listings, actual closed sales prices in the Los Angeles metro area continue to exhibit positive year-over-year appreciation due to our severe supply deficit.
2. What is causing housing inventory to remain flat?
The primary driver is the “lock-in effect.” Most existing homeowners hold fixed mortgage rates well below 4% and are financially disincentivized to sell and buy another home at current rates, keeping properties off the market.
3. What are current mortgage rates in June 2026?
Average 30-year fixed mortgage rates have bounced off their recent lows and are currently hovering around 6.58%, keeping them within the standard 3-year historical channel of 6.5% to 7.25%.
4. Is a real estate market crash expected later this year?
No. The credit foundation is strong, with mortgage delinquencies sitting at an exceptionally low 1.1%. Homeowners have substantial equity positions, preventing distressed or forced foreclosure inventory waves.
5. How does the stock market affect the Los Angeles real estate market?
A strong stock market creates a “wealth effect.” The capital gains accumulated by affluent buyers in April, May, and June provide liquid capital for larger down payments and increase overall luxury buyer confidence.
6. Should I wait for interest rates to drop before buying an L.A. home?
Waiting carries risk. A meaningful drop in interest rates will likely trigger a surge in buyer demand, sparking competitive bidding wars that could drive home prices up faster than any savings gained from a lower rate.
7. What does the increase in pending home sales indicate?
Nine consecutive weeks of increased pending home sales nationwide demonstrate that buyers have adapted to current rate structures and are actively moving forward with transactions compared to last year.
8. Is new home construction going to increase inventory in Los Angeles soon?
Unlikely. Building permits, starts, and units under construction are in a multi-year decline. New home completions are at their lowest levels since the pandemic, making existing homes the primary option for buyers.
9. How is inflation currently impacting real estate decisions?
With CPI at 4.2% and PCE at 3.8%, persistent inflation keeps interest rates elevated. However, real estate continues to serve as an effective long-term asset class hedge against inflation.
10. Are corporate relocations still driving the local housing market?
While the labor market is stable, the broad hiring rate has softened slightly to 3.2%, meaning work-related relocations have slowed slightly. Demand remains driven primarily by local buyers capitalising on equity wealth.
11. What is the national median list price for a single-family home right now?
The 13-week rolling average for the national median price of an active single-family listing is approximately $447,000, though core Los Angeles neighborhoods command a significant structural premium above this average.
12. Are sellers accepting contingencies in the current market environment?
Sellers prefer clean, non-contingent offers. However, because buyers are highly analytical regarding property condition, proper inspection and appraisal parameters remain standard components of successful negotiations.
13. How much equity does the average homeowner currently hold?
Due to years of steady property appreciation and minimal distressed sales, American homeowners hold near-record levels of net equity, providing excellent household financial security.
14. What is the projected volume for existing home sales this year?
The National Association of Realtors tracks existing home sales at a seasonally adjusted annual rate of roughly 4.2 million units, matching initial annual forecasts for 2026.
15. How can I accurately determine the current value of my home?
Relying on automated online valuation algorithms often misses hyper-local neighborhood nuances. The most effective method is to request a comprehensive Custom Equity Audit prepared by an active local real estate expert.
Next Steps to Build Your Real Estate Strategy
Navigating the nuances of the Los Angeles real estate market requires an approach rooted in real-time data and local specialization. Whether you want to strategically deploy capital into a new primary residence or maximize the equity return on an existing property asset, setting a clear plan is paramount.
Schedule a Strategy Call with Melissa Menard
Melissa Menard REALTOR® | Compass
Los Angeles & Surrounding Areas
📞 310.729.9726 | DRE# 01858710
📧 melissa@melissamenardhomes.com
🌐 www.MelissaMenardHomes.com
Disclaimer: The information provided in this post is for educational purposes only and does not constitute financial, legal, or investment advice. Market conditions are subject to change. Please consult with a qualified professional regarding your specific real estate needs and local Fair Housing regulations.